Music Visualizations Final Project - Gavin Hewitt
Project Overview
For my final project, I chose to visualize different characteristics of music found on Spotify to explore
the relationships between them using
the Spotify Tracks Dataset from Kaggle, found here.
You can find information on every field in the dataset at the provided link; here is a description of each
field used in the project:
-
Danceability: Danceability describes how suitable a track is for dancing based on a
combination of musical elements including tempo,
rhythm stability, beat strength, and overall regularity. A value of 0.0 is least danceable and 1.0 is
most danceable.
-
Energy: Energy is a measure from 0.0 to 1.0 and represents a perceptual measure of
intensity and activity. Typically,
energetic tracks feel fast, loud, and noisy. For example, death metal has high energy, while a Bach
prelude scores low on the scale.
-
Key: The key the track is in using standard Pitch Class notation.
-
Mode: Mode indicates the modality (major or minor) of a track, the type of scale from
which its melodic content is derived.
-
Instrumentalness: Predicts whether a track contains no vocals. "Ooh" and "aah" sounds
are treated as instrumental in this context.
Rap or spoken word tracks are clearly "vocal". The closer the instrumentalness value is to 1.0, the
greater likelihood the track contains no vocal content.
-
Liveness: Detects the presence of an audience in the recording. Higher liveness values
represent an increased probability that the track
was performed live. A value above 0.8 provides strong likelihood that the track is live.
-
Valence: A measure from 0.0 to 1.0 describing the musical positiveness conveyed by a
track. Tracks with high valence sound more positive
(e.g. happy, cheerful, euphoric), while tracks with low valence sound more negative (e.g. sad,
depressed, angry).
-
Tempo: The overall estimated tempo of a track in beats per minute (BPM). In musical
terminology, tempo is the speed or pace of a given piece
and derives directly from the average beat duration.
-
Track Genre: The genre in which the track belongs.
Popularity of Keys Across Genres
This is a heatmap that compares the popularity of every key within different genres. For example, in the top
left, every acoustic song in the key C,
regardless of mode, have a combined popularity score of 6,053. Within the dataset, the two most common keys
are C and G, which appear to be the two most popular
keys, as well. It's understandable that these keys are used most often in music, as they are two of the
simplest to play.
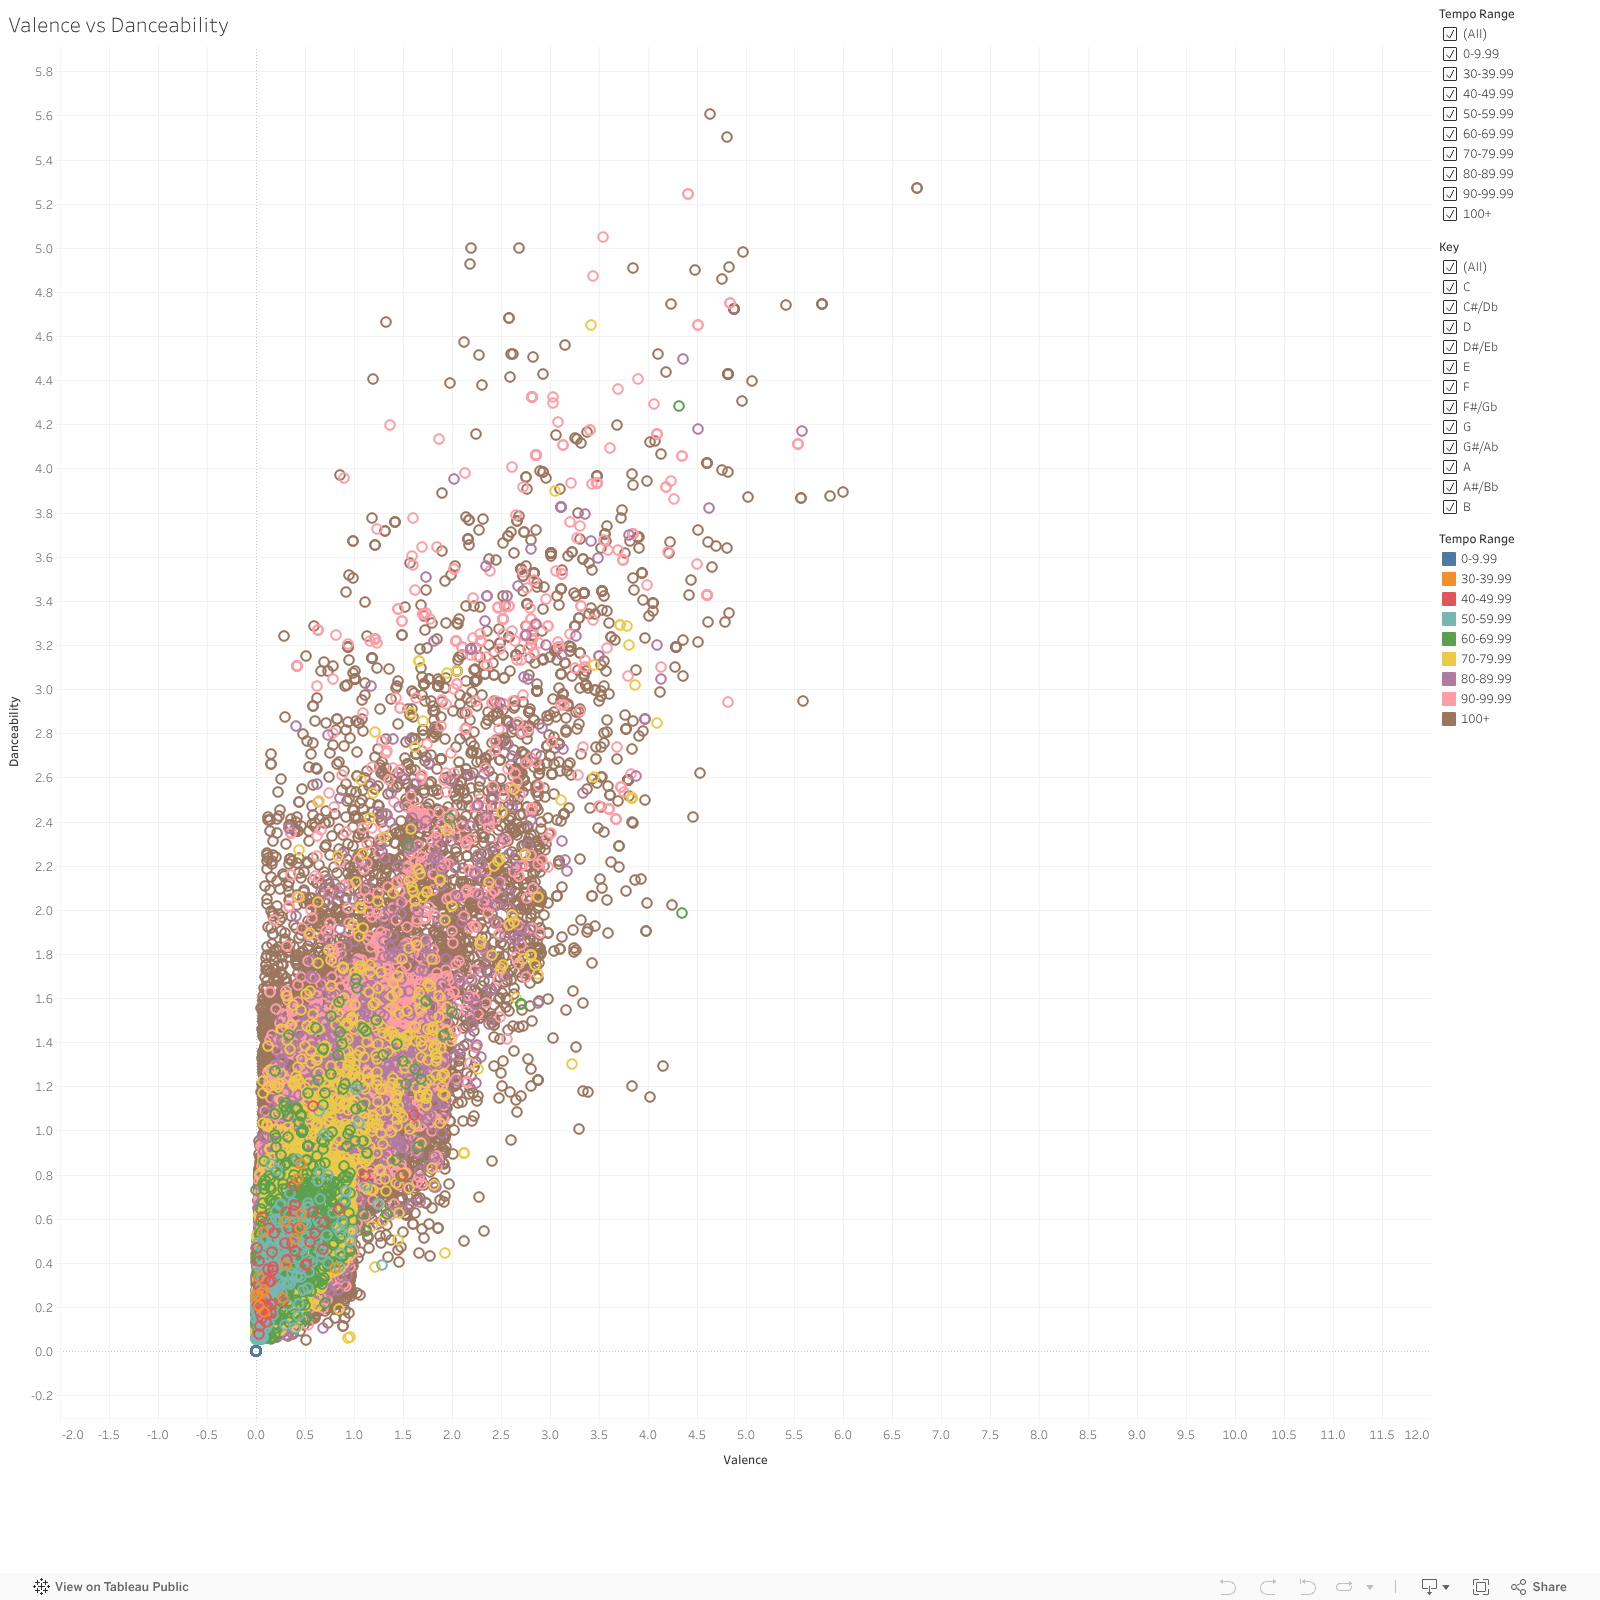
Valence vs Danceability Scatterplot
This scatterplot explores correlations between valence and danceability in a song. Naturally, one would
expect a danceable song to be considered positive, or
having a high valence score. This trend is generally observed within the plot, as the points trend upwards
and to the right as you continue through the graph
with a few outliers. Tempo range is a calculated field I made to make it easier to categorize datapoints by
tempo.
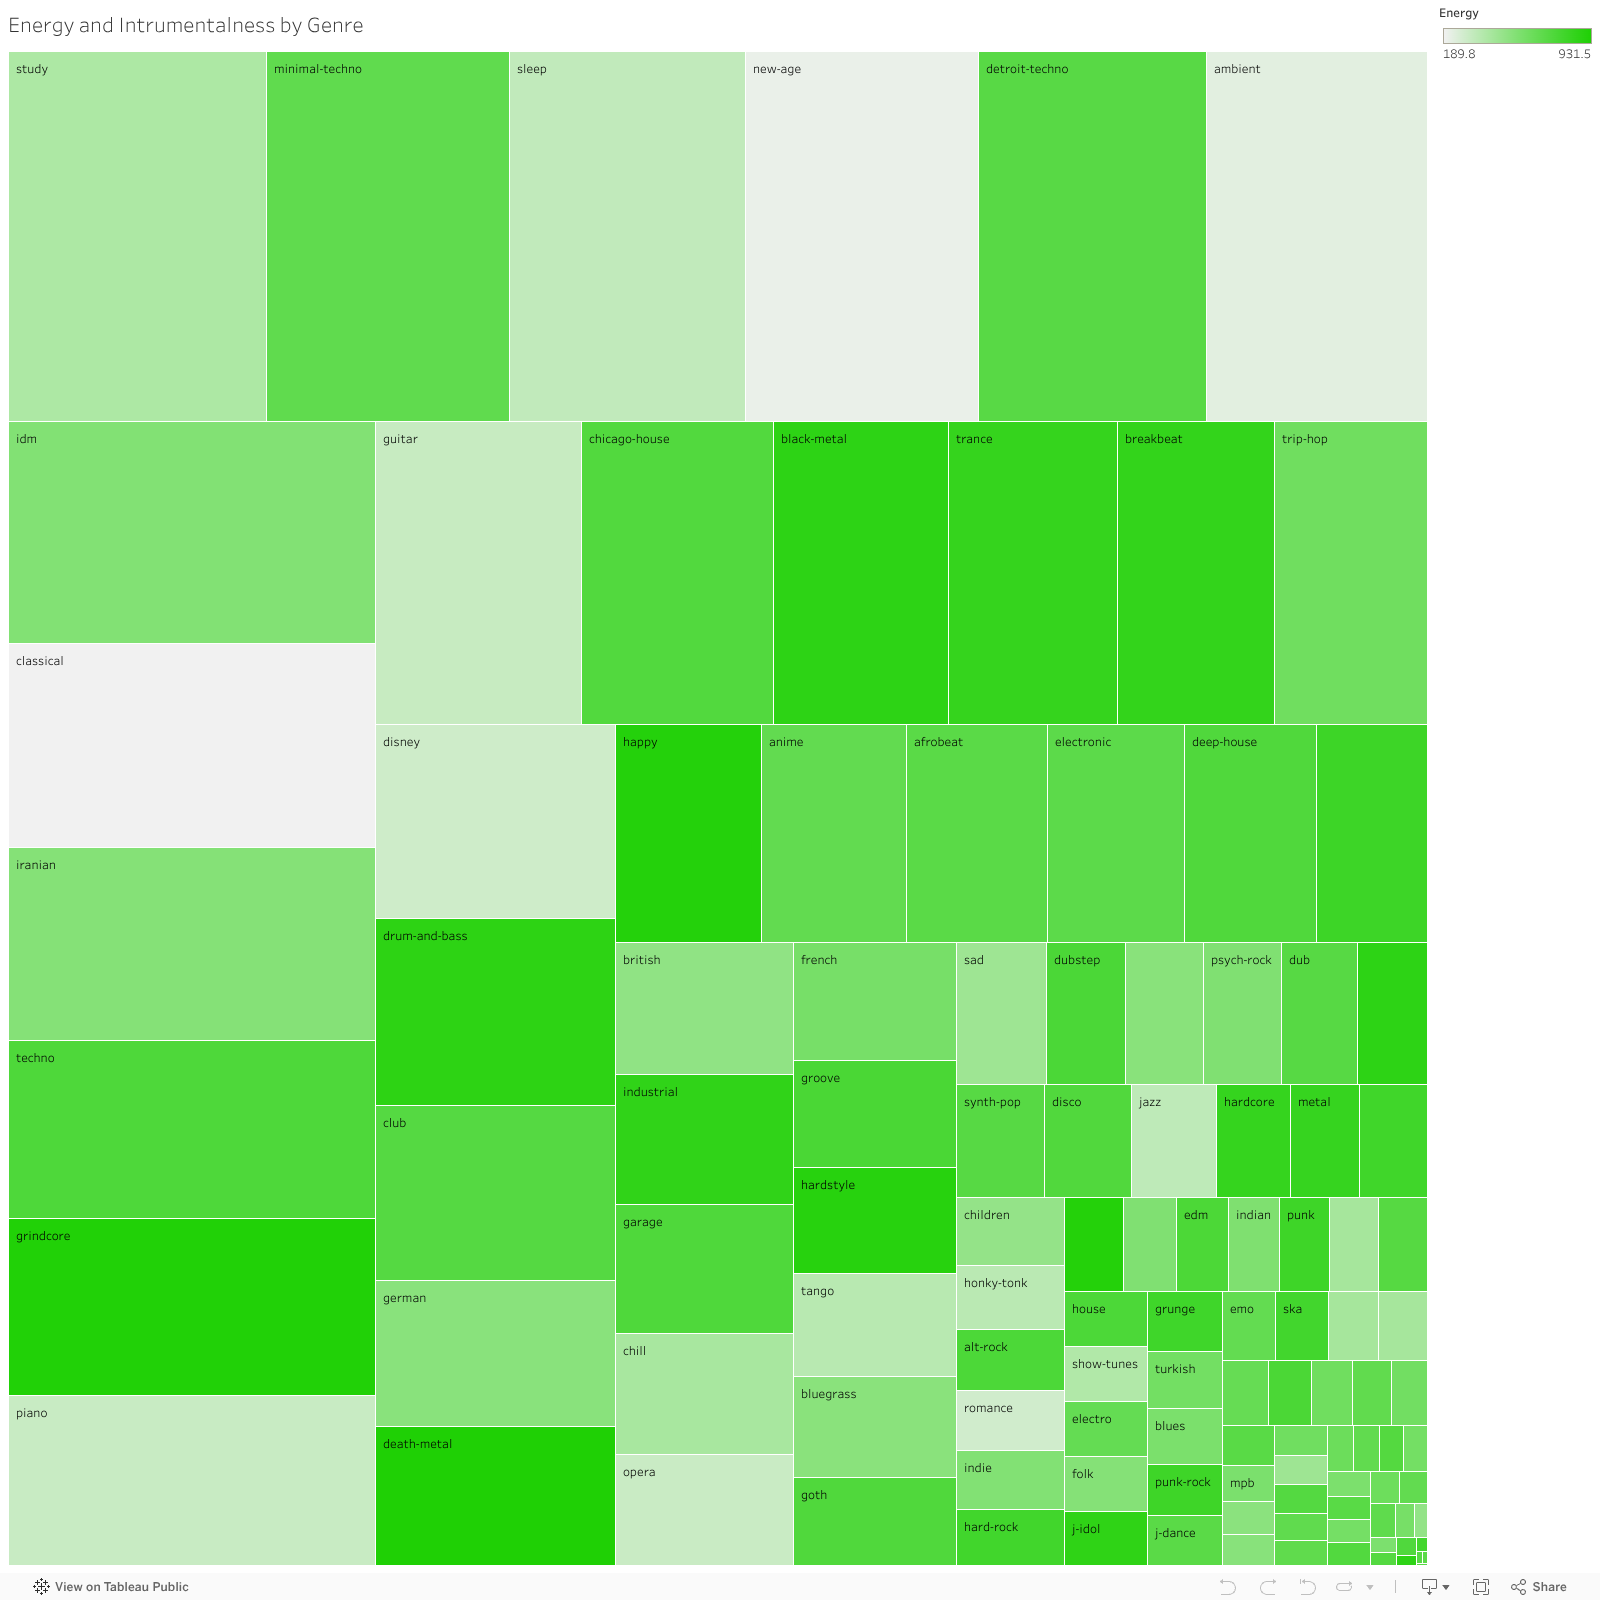
Energy and Instrumentalness by Genre
This treemap compares every genre by instrumentalness first, then energy. The size of each square is the sum
of instrumentalness within the genre,
and the color is the sum of energy. I found it interesting to see that there is no obvious correlation
between instrumentalness and energy across genres.
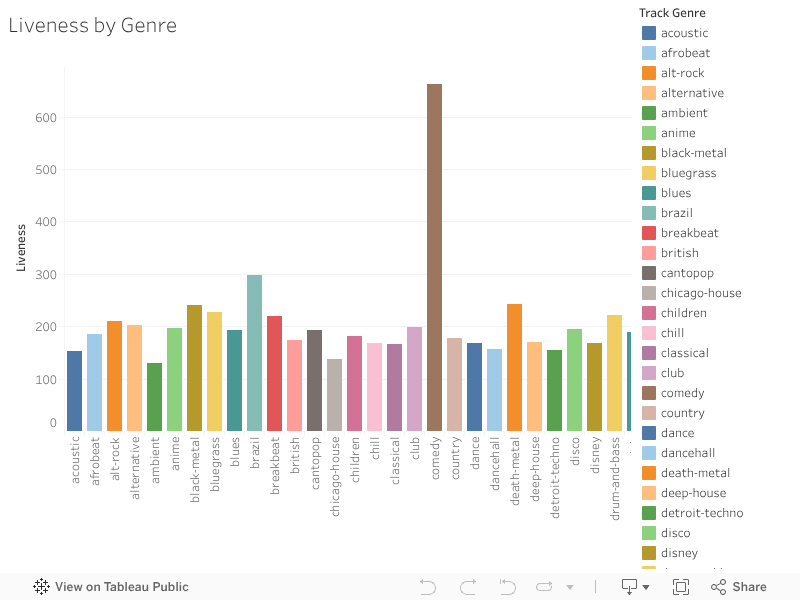
Liveness by Genre
This is a bar chart measuring the sum of liveness of each genre. I decided to do this visualization to see
if there were any genres on Spotify that
were recorded live more than others, and as you can see, there are a few! Comedy, pagode, samba, and
sertanejo appear to have the most live recordings
uploaded to Spotify.
Bar Charts by Key and Mode
This is a story of three different bar charts, all measuring a different value by key and mode. When first
looking at this dataset, I had a feeling
that there would be a correlation between valence, popularity, and danceability. I explored the relationship
between valence and danceability in the
scatterplot above, but I wanted to see how they would compare to one another from a bar chart perspective
and when considered alongside mode and key.
As you can see when tabbing through the story, there is little to no change between the charts. I expected
this, as one could infer that a song that
is considered more positive, or to have a higher valence, would be more danceable; if a song is more
danceable, it's likely that more people will listen
to the song, boosting its popularity. I found it very interesting that in the key of B, minor songs are
considered more popular, danceable, and have a higher
valence, which is the oppostite of what I would expect when comparing these across modes.